Main article: 1880 United States presidential election
1880 United States presidential election in Missouri
Hancock
40-50%
50-60%
60-70%
70-80%
80-90%
Garfield
30-40%
40-50%
50-60%
60-70%
70-80%
Weaver
30-40%
40-50%
The 1880 United States presidential election in Missouri took place on November 2, 1880, as part of the 1880 United States presidential election . Voters chose 15 representatives, or electors to the Electoral College , who voted for president and vice president .
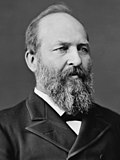
Missouri voted for the Democratic nominee, Winfield Scott Hancock , over the Republican nominee, James A. Garfield by a margin of 13.84%.
Results
Results by County
1880 United States Presidential Election in Missouri (By County)
County
Winfield Scott Hancock
Democratic
James A. Garfield
Republican
James B. Weaver
Greenback
Total Votes Cast
#
%
#
%
#
%
Adair
1,269
39.02%
1,657
50.95%
326
10.02%
3,252
Andrew
1,571
45.23%
1,781
51.28%
121
3.48%
3,473
Atchison
1,261
42.33%
1,228
41.22%
490
16.45%
2,979
Audrain
2,322
60.55%
983
25.63%
530
13.82%
3,835
Barry
1,163
47.28%
970
39.43%
327
13.29%
2,460
Barton
942
41.81%
599
26.59%
712
31.60%
2,253
Bates
2,949
57.93%
1,897
37.26%
245
4.81%
5,091
Benton
962
41.29%
1,204
51.67%
164
7.04%
2,330
Bollinger
1,068
58.88%
629
34.67%
117
6.45%
1,814
Boone
3,269
67.30%
1,170
24.09%
418
8.61%
4,857
Buchanan
4,693
55.86%
3,317
39.48%
391
4.65%
8,401
Butler
746
66.79%
275
24.62%
96
8.59%
1,117
Caldwell
1,139
39.53%
1,369
47.52%
373
12.95%
2,881
Callaway
3,369
72.25%
1,184
25.39%
110
2.36%
4,663
Camden
507
40.02%
563
44.44%
197
15.55%
1,267
Cape Girardeau
1,869
51.74%
1,641
45.43%
102
2.82%
3,612
Carroll
2,404
49.55%
2,039
42.02%
409
8.03%
4,852
Carter
238
64.67%
80
21.74%
50
13.59%
368
Cass
2,710
57.72%
1,710
36.42%
275
5.86%
4,695
Cedar
900
43.19%
926
44.43%
258
12.38%
2,084
Chariton
2,899
57.25%
1,617
31.93%
548
10.82%
5,064
Christian
438
26.26%
791
47.42%
439
26.32%
1,668
Clark
1,570
49.17%
1,503
47.07%
120
3.76%
3,193
Clay
2,969
79.15%
589
15.70%
193
5.15%
3,751
Clinton
2,061
59.14%
1,237
35.49%
187
5.37%
3,485
Cole
1,384
49.84%
1,338
48.18%
55
1.98%
2,777
Cooper
2,189
51.01%
1,730
40.32%
372
8.67%
4,291
Crawford
1,099
55.70%
805
40.80%
69
3.50%
1,973
Dade
902
38.11%
1,227
51.84%
238
10.05%
2,367
Dallas
487
28.71%
654
38.56%
555
32.72%
1,696
Daviess
2,045
49.56%
1,796
43.53%
285
6.91%
4,126
DeKalb
1,305
47.21%
1,238
44.79%
221
8.00%
2,764
Dent
1,073
59.12%
707
38.95%
35
1.93%
1,815
Douglas
163
13.40%
497
40.87%
556
45.72%
1,216
Dunklin
1,330
87.96%
182
12.04%
0
0.00%
1,512
Franklin
2,262
45.36%
2,647
53.08%
78
1.56%
4,987
Gasconade
487
24.36%
1,512
75.64%
0
0.00%
1,999
Gentry
1,982
53.67%
1,377
37.29%
334
9.04%
3,693
Greene
1,912
35.43%
2,198
40.73%
1,286
21.83%
5,396
Grundy
1,102
35.06%
1,917
60.99%
124
3.95%
3,143
Harrison
1,586
40.44%
2,097
53.47%
239
6.09%
3,922
Henry
2,821
58.51%
1,694
35.14%
306
6.35%
4,821
Hickory
436
31.99%
675
49.52%
252
18.49%
1,363
Holt
1,297
41.65%
1,605
51.54%
212
6.81%
3,114
Howard
2,047
54.92%
1,166
31.29%
514
13.79%
3,727
Howell
726
52.16%
457
32.83%
209
15.01%
1,392
Iron
854
60.06%
565
39.73%
3
0.21%
1,422
Jackson
6,703
53.36%
5,123
40.78%
735
5.85%
12,561
Jasper
2,533
38.87%
2,874
44.10%
1,110
17.03%
6,517
Jefferson
2,012
56.28%
1,501
41.99%
62
1.73%
3,575
Johnson
2,795
50.70%
2,400
43.53%
318
5.77%
5,513
Knox
1,468
52.30%
574
20.45%
765
27.25%
2,807
Laclede
960
45.74%
365
17.39%
774
36.87%
2,099
Lafayette
3,163
62.18%
1,822
35.82%
102
2.01%
5,087
Lawrence
1,476
43.67%
1,567
46.36%
337
9.97%
3,380
Lewis
1,928
59.65%
1,152
35.64%
152
4.70%
3,232
Lincoln
2,039
58.88%
790
22.81%
634
18.31%
3,463
Linn
2,049
48.53%
1,991
47.16%
182
4.31%
4,222
Livingston
1,859
43.31%
1,165
27.14%
1,268
29.54%
4,292
Macon
2,880
52.84%
1,726
31.67%
844
15.49%
5,450
Madison
952
70.83%
391
29.09%
1
0.07%
1,344
Maries
924
72.76%
288
22.68%
58
4.57%
1,270
Marion
3,086
61.92%
1,811
36.34%
87
1.75%
4,984
McDonald
706
50.79%
213
15.32%
471
33.88%
1,390
Mercer
990
35.43%
1,573
56.30%
231
8.27%
2,794
Miller
757
39.97%
970
51.21%
167
8.82%
1,894
Mississippi
1,137
64.06%
525
29.58%
113
6.37%
1,775
Moniteau
1,323
46.93%
853
30.26%
643
22.81%
2,819
Monroe
3,488
81.51%
671
15.68%
120
2.80%
4,279
Montgomery
1,721
50.72%
1,329
39.17%
343
10.11%
3,393
Morgan
950
52.63%
798
44.21%
57
3.16%
1,805
New Madrid
1,095
77.33%
321
22.67%
0
0.00%
1,416
Newton
1,535
44.33%
957
27.63%
971
28.04%
3,463
Nodaway
2,485
43.38%
2,303
40.20%
941
16.43%
5,729
Oregon
809
88.22%
85
9.27%
23
2.51%
917
Osage
1,137
50.22%
1,117
49.34%
10
0.44%
2,264
Ozark
314
36.73%
409
47.84%
132
15.44%
855
Pemiscot
740
89.70%
85
10.30%
0
0.00%
825
Perry
1,110
53.68%
887
42.89%
71
3.43%
2,068
Pettis
2,908
51.28%
2,457
43.33%
306
5.40%
5,671
Phelps
1,132
54.01%
416
19.85%
548
26.15%
2,096
Pike
3,236
57.01%
2,151
37.90%
289
5.09%
5,676
Platte
2,693
73.04%
945
25.63%
49
1.33%
3,687
Polk
1,360
43.65%
1,506
48.33%
250
8.02%
3,116
Pulaski
772
61.61%
462
36.87%
19
1.52%
1,253
Putnam
725
27.24%
1,513
56.84%
424
15.93%
2,662
Ralls
1,800
74.47%
603
24.95%
14
0.58%
2,417
Randolph
2,927
63.92%
1,051
22.95%
601
13.13%
4,579
Ray
2,614
63.91%
908
22.20%
568
13.89%
4,090
Reynolds
747
84.31%
139
15.69%
0
0.00%
886
Ripley
578
75.75%
115
15.07%
70
9.17%
763
Saline
3,851
62.96%
1,907
31.18%
359
5.87%
6,117
Schuyler
1,065
50.91%
570
27.25%
457
21.85%
2,092
Scotland
1,405
54.61%
689
26.78%
479
18.62%
2,573
Scott
1,330
74.34%
459
25.66%
0
0.00%
1,789
Shannon
467
86.32%
65
12.01%
9
1.66%
541
Shelby
1,770
59.66%
350
28.55%
847
11.80%
2,967
St. Charles
2,191
49.27%
2,223
49.99%
33
0.74%
4,447
St. Clair
963
34.63%
765
27.51%
1,053
37.86%
2,781
St. Francois
1,750
67.62%
778
30.06%
60
2.32%
2,588
St. Louis
2,719
45.73%
3,223
54.20%
4
0.07%
5,946
St. Louis City
23,837
49.96%
23,006
48.22%
872
1.83%
47,715
Ste. Genevieve
1,081
61.04%
650
36.70%
40
2.26%
1,771
Stoddard
1,541
69.32%
590
26.54%
92
4.14%
2,223
Stone
140
19.69%
435
61.18%
136
19.13%
711
Sullivan
1,717
47.73%
1,693
47.07%
187
5.20%
3,597
Taney
313
36.52%
337
39.32%
207
24.15%
857
Texas
1,250
62.13%
477
23.71%
285
14.17%
2,012
Vernon
2,338
64.27%
940
25.84%
360
9.90%
3,638
Warren
662
29.98%
1,343
60.82%
203
9.19%
2,208
Washington
1,489
63.58%
775
33.09%
78
3.33%
2,342
Wayne
1,114
64.47%
568
32.87%
46
2.66%
1,728
Webster
1,024
46.52%
561
25.49%
616
27.99%
2,201
Worth
751
47.80%
657
41.82%
163
10.38%
1,571
Wright
409
28.90%
641
45.30%
365
25.80%
1,415
Totals
208,600
52.51%
153,647
38.67%
35,042
8.82%
397,289
Counties that flipped from Republican to Democratic
Counties that flipped from Democratic to Republican
Counties that flipped from Democratic to Greenback
Counties that flipped from Republican to Greenback
See also
References
"1880 Presidential General Election Results - Missouri" ."Our Campaigns - MO US President Race - Nov 02, 1880" . www.ourcampaigns.com . Retrieved November 11, 2024.
Categories :
Text is available under the Creative Commons Attribution-ShareAlike License. Additional terms may apply.
**DISCLAIMER** We are not affiliated with Wikipedia, and Cloudflare.
The information presented on this site is for general informational purposes only and does not constitute medical advice.
You should always have a personal consultation with a healthcare professional before making changes to your diet, medication, or exercise routine.
AI helps with the correspondence in our chat.
We participate in an affiliate program. If you buy something through a link, we may earn a commission 💕
↑
 County Results


