Main article: 2004 United States presidential election
| ||||||||||||||||||||||||||
| Turnout | 76.3% (of registered voters) 49.6% (of voting age population) | |||||||||||||||||||||||||
|---|---|---|---|---|---|---|---|---|---|---|---|---|---|---|---|---|---|---|---|---|---|---|---|---|---|---|
| ||||||||||||||||||||||||||
 County Results County Results Congressional District Results Congressional District Results
| ||||||||||||||||||||||||||
| ||||||||||||||||||||||||||
The 2004 United States presidential election in Arizona took place on November 2, 2004, and was part of the 2004 United States presidential election. Voters chose 10 representatives, or electors, to the Electoral College, who voted for president and vice president.
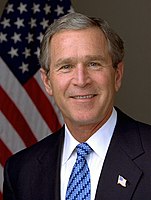
Arizona was won by incumbent George W. Bush by 10.5%. Prior to the election, 12 news organizations considered this a state Bush would win, or otherwise considered as a likely red state. Neither major party tickets campaigned here in the fall election. Arizona hosted the third presidential debate on October 13, 2004, in the city of Tempe.
As of the 2024 presidential election, this is the last time Arizona was won by a double-digit margin of victory. This was the first election in which any candidate won more than a million votes as well as in which Maricopa County cast more than a million ballots.
Primaries
Campaign
Predictions
There were 12 news organizations who made state-by-state predictions of the election. Here are their last predictions before election day.
| Source | Ranking |
|---|---|
| D.C. Political Report | Solid R |
| Associated Press | Lean R |
| CNN | Likely R |
| Cook Political Report | Likely R |
| Newsweek | Solid R |
| New York Times | Lean R |
| Rasmussen Reports | Likely R |
| Research 2000 | Solid R |
| Washington Post | Likely R |
| Washington Times | Lean R |
| Zogby International | Likely R |
| Washington Dispatch | Likely R |
Polling
Main article: Statewide opinion polling for the 2004 United States presidential election: ArizonaThroughout several polls taken in the state in 2004, just one showed Kerry leading. The final 3 pre-election polls showed that Bush was leading with 51% to Kerry's 43%.
Fundraising
Bush raised $3,196,692. Kerry raised $1,525,930.
Advertising and visits
Neither campaign advertised or visited this state during the fall campaign.
Analysis
The exit polls showed that Bush was going to be the clear winner of the state, based on the fact that Bush won among both genders. A major key factor was how 55% of the people thought the state economy was good, and 70% of those people voted for Bush. Also, 55% of the state approved of Bush.
The key to Bush's victory was winning the highly populated Maricopa County with almost 57%. However, Kerry did win portions of the state such as Arizona's 4th congressional district and Arizona's 7th congressional district and 4 counties. 50% of the voting age population came out to vote.
Results
| 2004 United States presidential election in Arizona | |||||
|---|---|---|---|---|---|
| Party | Candidate | Votes | Percentage | Electoral votes | |
| Republican | George W. Bush (incumbent) | 1,104,294 | 54.77% | 10 | |
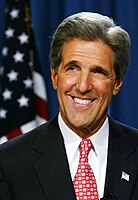
| Democratic | John Kerry | 893,524 | 44.32% | 0 | |
| Libertarian | Michael Badnarik | 11,856 | 0.59% | 0 | |
| Write In | Write-in candidate | 3,517 | 0.17% | 0 | |
| Write In | Ralph Nader | 2,773 | 0.14% | 0 | |
| Write In | David Cobb | 138 | 0.01% | 0 | |
| Totals | 2,012,585 | 100.00% | 10 | ||
| Voter turnout (voting age) | 49.6% | ||||
Results by county
| County | George W. Bush Republican |
John Kerry Democratic |
Michael Badnarik Libertarian |
Various candidates Write-ins |
Margin | Total votes cast | |||||
|---|---|---|---|---|---|---|---|---|---|---|---|
| # | % | # | % | # | % | # | % | # | % | ||
| Apache | 8,384 | 34.65% | 15,658 | 64.71% | 142 | 0.59% | 14 | 0.06% | −7,274 | −30.06% | 24,198 |
| Cochise | 26,556 | 59.55% | 17,514 | 39.27% | 318 | 0.71% | 207 | 0.46% | 9,042 | 20.28% | 44,595 |
| Coconino | 22,526 | 43.00% | 29,243 | 55.82% | 377 | 0.72% | 245 | 0.47% | −6,717 | −12.82% | 52,391 |
| Gila | 12,343 | 59.12% | 8,314 | 39.82% | 155 | 0.74% | 65 | 0.31% | 4,029 | 19.30% | 20,877 |
| Graham | 7,467 | 69.65% | 3,185 | 29.71% | 66 | 0.62% | 2 | 0.02% | 4,282 | 39.94% | 10,720 |
| Greenlee | 1,899 | 61.92% | 1,146 | 37.37% | 19 | 0.62% | 3 | 0.10% | 753 | 24.55% | 3,067 |
| La Paz | 3,158 | 62.42% | 1,849 | 36.55% | 45 | 0.89% | 7 | 0.14% | 1,309 | 25.87% | 5,059 |
| Maricopa | 679,455 | 56.86% | 504,849 | 42.25% | 6,776 | 0.57% | 3,881 | 0.32% | 174,606 | 14.61% | 1,194,961 |
| Mohave | 36,794 | 63.53% | 20,503 | 35.40% | 393 | 0.68% | 225 | 0.39% | 16,291 | 28.13% | 57,915 |
| Navajo | 17,277 | 53.32% | 14,815 | 45.72% | 224 | 0.69% | 88 | 0.27% | 2,462 | 7.60% | 32,404 |
| Pima | 171,109 | 46.56% | 193,128 | 52.55% | 2,109 | 0.57% | 1,146 | 0.31% | −22,019 | −5.99% | 367,492 |
| Pinal | 37,006 | 57.27% | 27,252 | 42.17% | 333 | 0.52% | 31 | 0.05% | 9,754 | 15.10% | 64,622 |
| Santa Cruz | 4,668 | 39.93% | 6,909 | 59.11% | 80 | 0.68% | 32 | 0.27% | −2,241 | −19.18% | 11,689 |
| Yavapai | 53,468 | 61.05% | 33,127 | 37.82% | 612 | 0.70% | 376 | 0.43% | 20,341 | 23.23% | 87,583 |
| Yuma | 22,184 | 57.58% | 16,032 | 41.61% | 207 | 0.54% | 106 | 0.28% | 6,152 | 15.97% | 38,529 |
| Totals | 1,104,294 | 54.77% | 893,524 | 44.32% | 11,856 | 0.59% | 6,428 | 0.32% | 210,770 | 10.45% | 2,016,102 |
Results by congressional district
Bush won six of eight congressional districts.
| District | Bush | Kerry | Representative |
|---|---|---|---|
| 1st | 54% | 46% | Rick Renzi |
| 2nd | 61% | 38% | Trent Franks |
| 3rd | 58% | 41% | John Shadegg |
| 4th | 38% | 62% | Ed Pastor |
| 5th | 54% | 45% | J. D. Hayworth |
| 6th | 64% | 35% | Jeff Flake |
| 7th | 43% | 57% | Raul Grijalva |
| 8th | 53% | 46% | Jim Kolbe |
Electors
Main article: List of 2004 United States presidential electorsTechnically the voters of Arizona cast their ballots for electors: representatives to the Electoral College. Arizona is allocated 10 electors because it has 8 congressional districts and 2 senators. All candidates who appear on the ballot or qualify to receive write-in votes must submit a list of 10 electors, who pledge to vote for their candidate and his or her running mate. Whoever wins the majority of votes in the state is awarded all 10 electoral votes. Their chosen electors then vote for president and vice president. Although electors are pledged to their candidate and running mate, they are not obligated to vote for them. An elector who votes for someone other than his or her candidate is known as a faithless elector.
The electors of each state and the District of Columbia met on December 13, 2004, to cast their votes for president and vice president. The Electoral College itself never meets as one body. Instead the electors from each state and the District of Columbia met in their respective capitols.
The following were the members of the Electoral College from this state. All were pledged to and voted for George W. Bush and Dick Cheney.
- Linda Barber
- Malcolm Barrett
- Jim Click
- Cynthia J. Collins
- Webb Crockett
- Elizabeth Wilkinson Fannin
- Ross Farnsworth
- Ira A. Fulton
- Bernice C. Roberts
- Phillip Townsend
Notes
References
- "Archived copy". dcpoliticalreport.com. Archived from the original on November 21, 2010. Retrieved January 17, 2022.
{{cite web}}: CS1 maint: archived copy as title (link) - "Election 2004 Polls - Dave Leip's Atlas of U.S. Presidential Elections". Archived from the original on July 20, 2012.
- "George W Bush – $374,659,453 raised, '04 election cycle, Republican Party, President". Campaignmoney.com. Retrieved May 31, 2015.
- "John F Kerry – $345,826,176 raised, '04 election cycle, Democratic Party, President". Campaignmoney.com. Retrieved May 31, 2015.
- "Specials". Cnn.com. Retrieved May 31, 2015.
- "Specials". Cnn.com. Retrieved May 31, 2015.
- "Election 2004". Cnn.com. April 13, 1970. Retrieved May 31, 2015.
- "Election 2004". Cnn.com. April 13, 1970. Retrieved May 31, 2015.
- "Archived copy" (PDF). Archived from the original (PDF) on May 13, 2009. Retrieved July 17, 2009.
{{cite web}}: CS1 maint: archived copy as title (link) - "2004 Presidential General Election Results – Arizona".
- ^ Our campaigns; AZ US President Race, November 02, 2004
- "Presidential Results by Congressional District, 2000–2008". Swingstateproject.com. December 15, 2008. Retrieved May 31, 2015.
- "Archived copy" (PDF). Archived from the original (PDF) on May 14, 2008. Retrieved June 27, 2009.
{{cite web}}: CS1 maint: archived copy as title (link)
| State and district results of the 2004 United States presidential election | ||
|---|---|---|
|  | |
| Governor | |||||
|---|---|---|---|---|---|
| Attorney General | |||||
| Secretary of State | |||||
| State Treasurer | |||||
| Superintendent of Public Instruction | |||||
| U.S. President | |||||
| U.S. Senate |
| ||||
| U.S. House | |||||
| See also: Political party strength in Arizona | |||||
| (2003 ←) 2004 United States elections (→ 2005) | |
|---|---|
| President | |
| U.S. Senate |
|
| U.S. House |
|
| State governors | |
| State legislatures |
|
| State officials |
|
| Mayors | |
| States |
|
| Elections in the United States | |
|---|---|
| |


