You can help expand this article with text translated from the corresponding article in French. (September 2020) Click for important translation instructions.
|
| ||||||||||||||||||||||||||||||||||||||||||||
All 74 French seats in the European Parliament | ||||||||||||||||||||||||||||||||||||||||||||
| Turnout | 42.43% | |||||||||||||||||||||||||||||||||||||||||||
|---|---|---|---|---|---|---|---|---|---|---|---|---|---|---|---|---|---|---|---|---|---|---|---|---|---|---|---|---|---|---|---|---|---|---|---|---|---|---|---|---|---|---|---|---|
| ||||||||||||||||||||||||||||||||||||||||||||
The 2014 European Parliament election in France for the election of the 8th delegation from France to the European Parliament took place on 24 May 2014 in the overseas territories of France, and on 25 May 2014 in metropolitan France. The number of seats allocated to France increased to 74, compared to 72 in the 2009 election, as a result of the 2013 reapportionment of seats in the European Parliament.
The members of the European Parliament for France, 2014–2019 were elected.
Previous (2009–2014) MEPs by European Political Group
| Key to the Political Groups in the European Parliament (France) Archived 3 January 2019 at the Wayback Machine | |||||
|---|---|---|---|---|---|
| National party | Seats/74 | EP group | Seats/754 | ||
| Union for a Popular Movement | 24 | European People's Party | 270 | ||
| Union of Democrats and Independents | 6 | ||||
| Europe Ecology – The Greens | 15 | The Greens–European Free Alliance | 59 | ||
| Party of the Corsican Nation | 1 | ||||
| Socialist Party | 13 | Socialists & Democrats | 189 | ||
| Democratic Movement | 5 | Alliance of Liberals and Democrats for Europe | 85 | ||
| CAP 21 | 1 | ||||
| Left Front | 5 | European United Left–Nordic Green Left | 34 | ||
| National Front | 3 | Non-Inscrits | |||
| Movement for France | 1 | Europe of Freedom and Democracy | 35 | ||
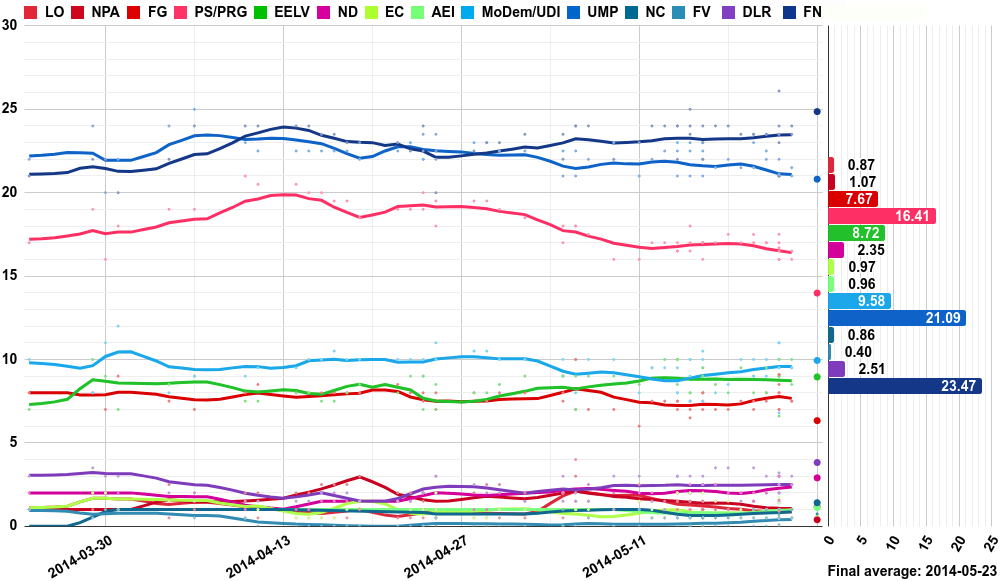
Opinion polls
Main article: Opinion polling for the 2014 European Parliament election in FranceResults
| Party | Votes | % | Seats | +/– | |
|---|---|---|---|---|---|
| National Front | 4,712,461 | 24.86 | 24 | +21 | |
| Union for a Popular Movement | 3,943,819 | 20.81 | 20 | –10 | |
| Socialist Party–Radical Party of the Left | 2,650,357 | 13.98 | 13 | –1 | |
| Union of Democrats and Independents–Democratic Movement | 1,884,565 | 9.94 | 7 | +1 | |
| Europe Ecology | 1,696,442 | 8.95 | 6 | –8 | |
| Left Front–Alliance of the Overseas | 1,252,730 | 6.61 | 4 | –1 | |
| Debout la République | 724,441 | 3.82 | 0 | 0 | |
| New Deal | 549,734 | 2.90 | 0 | New | |
| Nous Citoyens | 266,343 | 1.41 | 0 | New | |
| Lutte Ouvrière | 222,491 | 1.17 | 0 | 0 | |
| Independent Ecological Alliance | 211,759 | 1.12 | 0 | 0 | |
| Force Vie | 139,900 | 0.74 | 0 | New | |
| Citizen Europe | 127,849 | 0.67 | 0 | New | |
| Blank Vote Citizens | 110,090 | 0.58 | 0 | New | |
| Brittany Movement and Progress–Breton Party | 83,041 | 0.44 | 0 | New | |
| Popular Republican Union | 76,907 | 0.41 | 0 | New | |
| New Anticapitalist Party | 74,770 | 0.39 | 0 | 0 | |
| Régions et Peuples Solidaires | 65,054 | 0.34 | 0 | -1 | |
| Pirate Party | 39,338 | 0.21 | 0 | New | |
| Europe–Democracy–Esperanto | 33,115 | 0.17 | 0 | 0 | |
| Feminists for a United Europe | 27,119 | 0.14 | 0 | New | |
| European Federalist Party | 17,812 | 0.09 | 0 | New | |
| Cannabis Without Borders | 7,176 | 0.04 | 0 | 0 | |
| Communists | 4,547 | 0.02 | 0 | 0 | |
| Europe – Degrowth | 4,638 | 0.02 | 0 | 0 | |
| Real Democracy | 4,450 | 0.02 | 0 | New | |
| France Wakes Up | 4,444 | 0.02 | 0 | New | |
| For a Free Europe | 4,334 | 0.02 | 0 | New | |
| United Europe | 3,766 | 0.02 | 0 | New | |
| Alliance Royale | 3,127 | 0.02 | 0 | 0 | |
| Together for a Fair Europe | 1,400 | 0.01 | 0 | New | |
| Anti-Replacement List | 1,337 | 0.01 | 0 | New | |
| Radically Citizen | 1,291 | 0.01 | 0 | New | |
| European Party | 945 | 0.00 | 0 | New | |
| Occitania, for a Generation of Peoples | 877 | 0.00 | 0 | New | |
| Reunionese Citizen Movement | 827 | 0.00 | 0 | New | |
| Libertarian Program for an Exemplary Europe against Sexism and Precariousness | 499 | 0.00 | 0 | 0 | |
| Socialist Alternative Movement | 543 | 0.00 | 0 | New | |
| National Awakening Movement | 382 | 0.00 | 0 | New | |
| For a Europe Useful to the French | 355 | 0.00 | 0 | New | |
| Europe of Marrakech to Istanbul | 234 | 0.00 | 0 | New | |
| Ultramarines, Thank You! | 225 | 0.00 | 0 | New | |
| Syndicate of Struggle Against Banks | 129 | 0.00 | 0 | New | |
| Mayaud hors bords | 98 | 0.00 | 0 | New | |
| Total | 18,955,761 | 100.00 | 74 | 0 | |
| Valid votes | 18,955,761 | 95.99 | |||
| Invalid/blank votes | 792,132 | 4.01 | |||
| Total votes | 19,747,893 | 100.00 | |||
| Registered voters/turnout | 46,544,712 | 42.43 | |||
| Source: France Politique | |||||
by electoral division
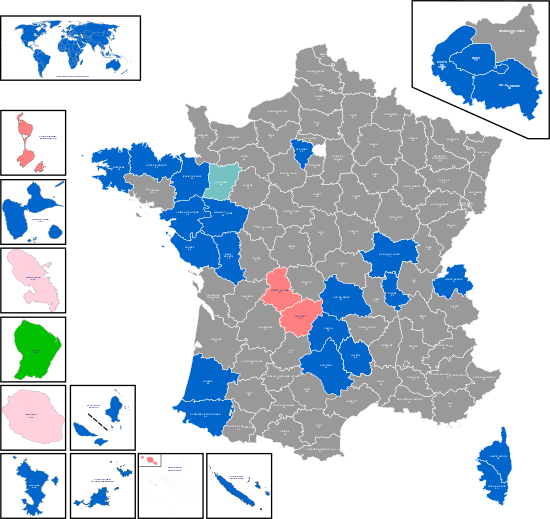
 Results by departement
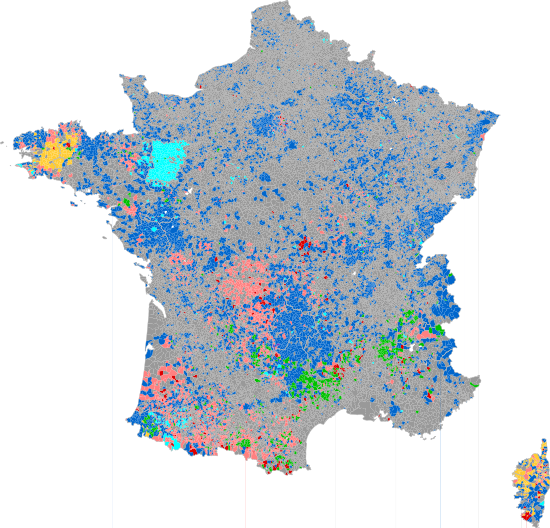
 Results by communes (Metropolitan France)
- National Front (FN)
- Union for a Popular Movement (UMP)
- Socialist Party / Radical Party of the Left (PS) / (PRG)
- Miscellaneous left
- The Alternative (L'Alternative)
- Europe Écologie (EE)
- Left Front (FG)
- Regionalist parties
References
| 1979 | |
|---|---|
| 1984 | |
| 1989 | |
| 1994 | |
| 1999 | |
| 2004 | |
| 2009 | |
| 2014 | |
| 2019 | |
| 2024 | |
| 2029 |
|
| Off-year | |

