"OH-10" redirects here. The term may also refer to Ohio State Route 10.
| Ohio's 10th congressional district | |
|---|---|
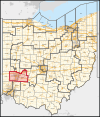 Interactive map of district boundaries since January 3, 2023 Interactive map of district boundaries since January 3, 2023 | |
| Representative | Mike Turner R–Dayton |
| Population (2023) | 784,462 |
| Median household income | $64,305 |
| Ethnicity |
|
| Cook PVI | R+4 |
Ohio's 10th congressional district is represented by Representative Mike Turner (R). The district is based in southwestern Ohio and consists of Montgomery County, Greene County, and a portion of Clark County. The cities of Dayton, Centerville, Xenia, and Springfield are part of the district.
Recent election results from statewide races
| Year | Office | Results |
|---|---|---|
| 2008 | President | Obama 50% - 48% |
| 2012 | President | Romney 50.03% - 49.97% |
| 2016 | President | Trump 51% - 45% |
| Senate | Portman 60% - 36% | |
| 2018 | Senate | Brown 53% - 47% |
| Governor | DeWine 52% - 45% | |
| Attorney General | Yost 53% - 47% | |
| 2020 | President | Trump 51% - 47% |
| 2022 | Senate | Vance 52% - 48% |
| Governor | DeWine 62% - 38% | |
| Secretary of State | LaRose 58% - 41% | |
| Treasurer | Sprague 57% - 43% | |
| Auditor | Faber 58% - 42% | |
| Attorney General | Yost 59% - 41% | |
| 2024 | President | Trump 52% - 47% |
| Senate | Brown 49% - 48% |
Composition
| # | County | Seat | Population |
|---|---|---|---|
| 23 | Clark | Springfield | 134,610 |
| 57 | Greene | Xenia | 169,691 |
| 113 | Montgomery | Dayton | 533,796 |
Cities and CDPs with 10,000 or more people
- Dayton – 135,512
- Springfield – 58,662
- Kettering – 57,862
- Beavercreek – 47,193
- Huber Heights – 43,439
- Fairborn – 34,729
- Centerville – 25,754
- Xenia – 25,441
- Riverside – 24,474
- Trotwood – 23,070
- Miamisburg – 19,923
- Springboro – 19,062
- Vandalia – 15,209
- Englewood – 13,249
- Clayton – 13,222
- West Carrollton – 13,129
2,500 – 10,000 people
- Oakwood – 9,572
- Bellbrook – 7,409
- Union – 6,859
- Moraine – 6,393
- Brookville – 5,918
- Germantown – 5,809
- Carlisle – 5,740
- Cedarville – 4,250
- New Lebanon – 3,796
- Yellow Springs – 3,697
- Fort McKinley – 3,473
List of members representing the district
Recent election results
The following chart shows historic election results. Bold type indicates victor. Italic type indicates incumbent.
| Year | Democratic | Republican | Other |
|---|---|---|---|
| 1920 | Benjamin F. Reynolds: 21,429 | Israel M. Foster: 38,436 | |
| 1922 | James Sharp: 17,811 | Israel M. Foster: 30,341 | |
| 1924 | W. F. Rutherford: 17,923 | Thomas A. Jenkins: 32,617 | |
| 1926 | Guy Stevenson: 14,460 | Thomas A. Jenkins: 25,571 | |
| 1928 | Charles E. Poston: 16,551 | Thomas A. Jenkins: 38,347 | |
| 1930 | H. L. Crary: 19,157 | Thomas A. Jenkins: 31,836 | |
| 1932 | Charles M. Hogan: 29,027 | Thomas A. Jenkins: 41,654 | |
| 1934 | W. F. Marting: 26,278 | Thomas A. Jenkins: 36,824 | |
| 1936 | O. J. Kleffner: 34,477 | Thomas A. Jenkins: 46,965 | |
| 1938 | Elsie Stanton: 24,198 | Thomas A. Jenkins: 47,036 | |
| 1940 | John P. Kelso: 33,698 | Thomas A. Jenkins: 48,217 | |
| 1942 | Oral Daugherty: 16,582 | Thomas A. Jenkins: 29,691 | |
| 1944 | Elsie Stanton: 23,986 | Thomas A. Jenkins: 43,388 | |
| 1946 | H. A. McCown: 17,719 | Thomas A. Jenkins: 35,406 | |
| 1948 | Delmar A. Canaday: 27,913 | Thomas A. Jenkins: 38,330 | |
| 1950 | William J. Curry: 21,117 | Thomas A. Jenkins: 39,584 | |
| 1952 | Delmar A. Canaday: 35,666 | Thomas A. Jenkins: 63,339 | |
| 1954 | Truman A. Morris: 28,150 | Thomas A. Jenkins: 45,277 | |
| 1956 | Thomas A. Jenkins: 71,295 | ||
| 1958 | Walter H. Moeller: 47,939 | Homer E. "Pete" Abele: 42,607 | |
| 1960 | Walter H. Moeller: 58,085 | Oakley C. Collins: 52,479 | |
| 1962 | Walter H. Moeller: 42,131 | Homer E. "Pete" Abele: 46,158 | |
| 1964 | Walter H. Moeller: 54,729 | Homer E. "Pete" Abele: 49,744 | |
| 1966 | Walter H. Moeller: 52,258 | Clarence E. Miller: 56,659 | |
| 1968 | Harry B. Crewson: 45,686 | Clarence E. Miller: 102,890 | |
| 1970 | Doug Arnett: 40,669 | Clarence E. Miller: 80,838 | |
| 1972 | Robert H. Whealey: 47,456 | Clarence E. Miller: 129,683 | |
| 1974 | H. Kent Bumpass: 42,333 | Clarence E. Miller: 100,521 | |
| 1976 | James A. Plummer: 57,757 | Clarence E. Miller: 127,147 | |
| 1978 | James A. Plummer: 35,039 | Clarence E. Miller: 99,329 | |
| 1980 | Jack E. Stecher: 49,433 | Clarence E. Miller: 143,403 | |
| 1982 | John M. Buchanan: 57,983 | Clarence E. Miller: 100,044 | |
| 1984 | John M. Buchanan: 55,172 | Clarence E. Miller: 149,337 | |
| 1986 | John M. Buchanan: 44,847 | Clarence E. Miller: 106,870 | |
| 1988 | John M. Buchanan: 56,893 | Clarence E. Miller: 143,673 | |
| 1990 | John M. Buchanan: 61,656 | Clarence E. Miller*: 106,009 | |
| 1992 | Mary Rose Oakar*: 103,788 | Martin R. Hoke: 136,433 | |
| 1994 | Francis E. Gaul: 70,918 | Martin R. Hoke: 95,226 | Joseph J. Jacobs Jr. (I): 17,495 |
| 1996 | Dennis J. Kucinich: 110,723 | Martin R. Hoke: 104,546 | Robert B. Iverson (N): 10,415 |
| 1998 | Dennis J. Kucinich: 110,552 | Joe Slovenec: 55,015 | |
| 2000 | Dennis J. Kucinich: 167,063 | Bill Smith: 48,930 | Ron Petrie (L): 6,762 |
| 2002 | Dennis J. Kucinich: 129,997 | Jon A. Heben: 41,778 | Judy Locy (I): 3,761 |
| 2004 | Dennis J. Kucinich: 167,221 | Edward F. Herman: 94,120 | Barbara Ferris (IOC): 17,753 |
| 2006 | Dennis J. Kucinich: 126,633 | Michael D. Dovilla: 64,318 | |
| 2008 | Dennis J. Kucinich: 157,268 | James P. Trakas: 107,918 | Paul Conroy (L): 10,623 |
| 2010 | Dennis J. Kucinich: 101,343 | Peter Corrigan: 83,809 | Jeff Goggins (L): 5,874 |
| 2012 | Sharen Neuhardt : 131,097 | Michael R. Turner : 208,201 | David Harlow (L) : 10,373 |
| 2014 | Robert Klepinger: 63,249 | Michael R. Turner : 130,752 | David Harlow (L) : 6,650 |
| 2016 | Robert Klepinger: 109,981 | Michael R. Turner : 215,724 | Tom McMaster (I): 10,890
David Harlow (WI): 7 |
| 2018 | Theresa Gasper: 118,785 | Michael R. Turner : 157,554 | David Harlow (L) : 5,387 |
| 2020 | Desiree Tims: 151,976 | Michael R. Turner : 212,972 | |
| 2022 | David Esrati: 104,634 | Michael R. Turner : 168,327 |
Recent statewide election results
Results under current lines (since 2023)
| Year | Office | Results |
|---|---|---|
| 2016 | President | Donald Trump 50.7% - Hillary Clinton 44.6% |
| Senate | Rob Portman 59.6% - Ted Strickland 36.1% | |
| 2018 | Senate | Sherrod Brown 53.4% - Jim Renacci 46.6% |
| Governor | Mike Dewine 51.7% - Richard Cordray 45.3% | |
| 2020 | President | Donald Trump 50.9%- Joe Biden 47.4% |
Historical district boundaries


See also
- Ohio's 10th congressional district Democratic primary election 2008
- Ohio's congressional districts
- List of United States congressional districts
References
- Bureau, Center for New Media & Promotion (CNMP), US Census. "My Congressional District". www.census.gov.
{{cite web}}:|last=has generic name (help)CS1 maint: multiple names: authors list (link) - "My Congressional District".
- "2022 Cook PVI: District Map and List". Cook Political Report. July 12, 2022. Retrieved January 10, 2023.
- "Representative Michael R. Turner". Congress.gov.
- https://davesredistricting.org/maps#viewmap::64d56870-70ea-4f4d-b667-9a4fd60ac511
- https://opoliticsguru.github.io/2024-Presidential-Election-Results-Ohio/#6/42.253/-77.783
- "2024 U.S. Senate Election in Ohio: Official Results".
- Federal Elections 2008. Federal Elections Commission, Washington DC, July 2009
- "2012 Election Results". Ohio Secretary of State.
- "2022 Cook PVI: District Map and List". Cook Political Report. July 12, 2022. Retrieved January 22, 2023.
- Martis, Kenneth C. (1989). The Historical Atlas of Political Parties in the United States Congress. New York: Macmillan Publishing Company.
- Martis, Kenneth C. (1982). The Historical Atlas of United States Congressional Districts. New York: Macmillan Publishing Company.
- Congressional Biographical Directory of the United States 1774–present
| Ohio's congressional districts | |
|---|---|
|
| Dennis Kucinich | ||
|---|---|---|
| People |  | |
| Politics | ||
| Other | ||
39°42′05″N 83°57′32″W / 39.70139°N 83.95889°W / 39.70139; -83.95889
Categories:

